


Smart marketers know there is gold hiding in their website analytics.
Successful marketers know how to find it.
It’s just a matter of understanding how to think about website analytics.
(RELATED: Applying Website Analytics to Your Digital Marketing)
Want to know how to get started? Simple — start asking questions.
It would be impossible to cover the 100’s of thousands of opportunities you can uncover in Google Analytics. But it is very possible for me to teach you how to think about website analytics.
Here are some of the questions I’ve recently asked at SeriouslySimpleMarketing and the Google Analytics reports that answered those questions.
Start asking questions about your business — then find the report that will answer this question.
Here’s what I mean…
Question 1: “Which types of visitors are finding it difficult to convert?”
This question finds money that’s been left on the table.
For example, you’ll often find web browsers (Chrome, Firefox, Safari, etc) or operating systems (Windows 7, Linux i686, etc.) that are having serious problems displaying your website.
When visitors can’t display your website — they click the back button.
Access the “Browser & OS” report. You can find that report in Google Analytics, under the “Audience” section here:
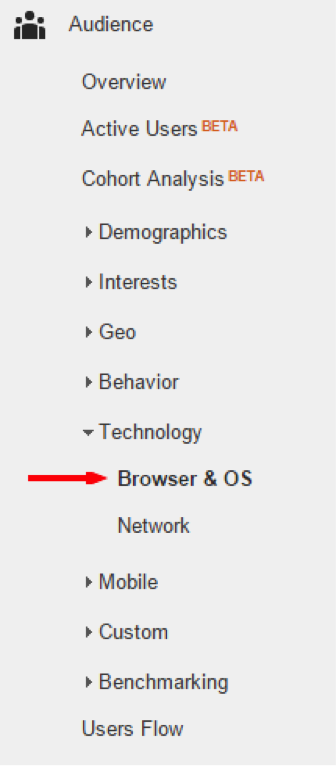
As you can see below, this report will start by showing you the browsers that your visitors are using to view your site.
Pretty quickly you can see if you’ve got a possible issue with a certain segment of visitors. In our case, we see that visitors who are using Internet Explorer aren’t converting at the same rate as those who are using Chrome, Firefox, or Safari.
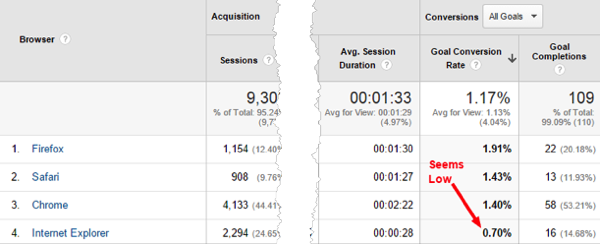
To figure out what might be going on, we’ll click on “Internet Explorer” to drill-down and take a look at the different versions people are using.
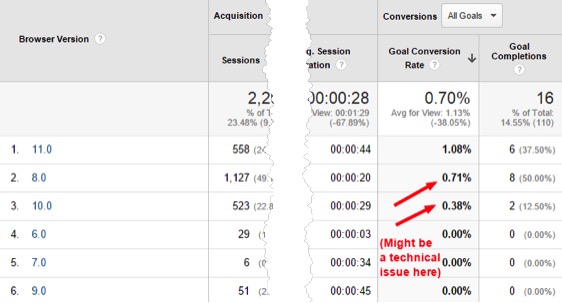
You can see that Internet Explorer versions 8 & 10 are really pretty low when it comes to conversion rates.
Chances are, there is a technical reason why this might be happening and our next step would be to use a tool like CrossBrowserTesting.com and view our site using those browser versions. If we do find a technical glitch, we fix it and expect our conversion rates to climb!
Here are some similar reports…
- The AUDIENCE > GEO > LOCATION report will show you if you are getting visits from geographic locations that are not converting. If the traffic is significant, fix the issues you are having with those geographic locations.
- The AUDIENCE > MOBILE > DEVICES report will show you if you are getting visits from particular mobile devices (Apple iPhone, Samsung Galaxy S5, etc.) that are not converting. If the traffic is significant, fix the issues you are having with those devices.
Pro Tip: If you don’t have conversion information to look at — use BOUNCE RATE as your metric for determining whether something is worth investigating.
Question 2: Are we producing the content our audience wants?
When we first started our blog, we kept the blog topics fairly general around the topic of marketing. Pretty quickly though, we started to wonder if we were hitting the mark.
Fortunately, Google Analytics has the answers.
One report you can access is called the “Search Terms” report. You can find that under the “Behavior” reports here:
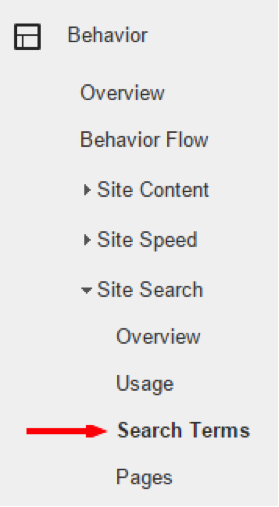
This isn’t a list of keywords that visitors typed in search engines like Google, Yahoo, or Bing. Instead, this report shows you a list of terms that people are searching for once they’ve reached your site (and used the search box that is the part of most blogs).

It’s an incredible way to find out exactly what’s on your visitors’ mind!
As I said earlier, when we first started our blog, we kept the blog topics pretty general. However, look what we found when we looked at our own “Search Terms” report:
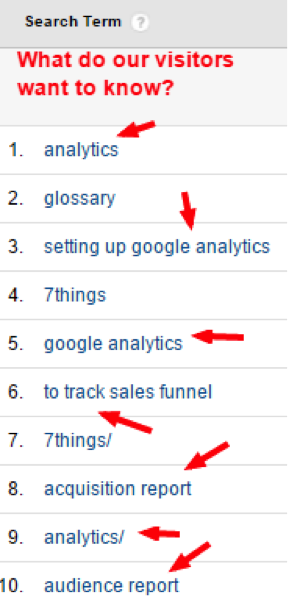
As it turns out, most of our visitors are searching our blog for topics related to Google Analytics (go figure!). Once we knew that, we started writing more posts about Google Analytics AND we started to create products to help our visitors discover how to use Google Analytics.
The best part is that you don’t have to guess about what to provide your users. With this report, you have a direct line to what your market is looking for so you can build the products and create the content they are telling you they want.
Here are some similar reports…
- The BEHAVIOR > SITE CONTENT > EXIT PAGES report will show you the pages where the highest volume of visitors exit your website. Some pages are natural exit pages for your site — others aren’t. Fix the ones that aren’t.
- The BEHAVIOR > SITE CONTENT > LANDING PAGES (add the SECONDARY DIMENSION of Medium and filter the Medium by Social) report will show you the pages that are getting the most social media engagement. Create more content like this — your people are telling you they like it.
Question 3 – Which pages can produce more leads and sales?
Finally, let’s cover how to use Google Analytics to reveal hidden lead and sales opportunities.
To do this, I like to start with the “Source/Medium” report. You’ll find that in the “Acquisition” reports here:
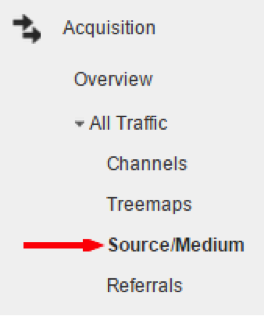
As you see below, this report will show you where your traffic is coming from.
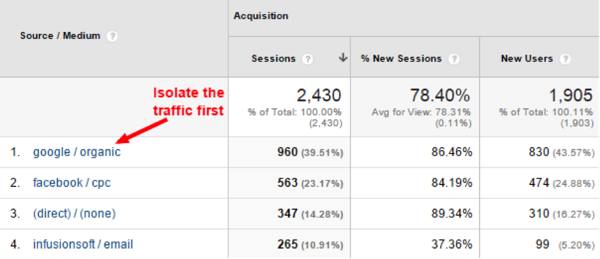
In this example, we wanted to be sure we were taking advantage of all the free traffic we were getting from Google. So we click on “google / organic” to isolate just that traffic source.
Then…
(HINT: Pay attention to this next step… it’s the “secret sauce!”)
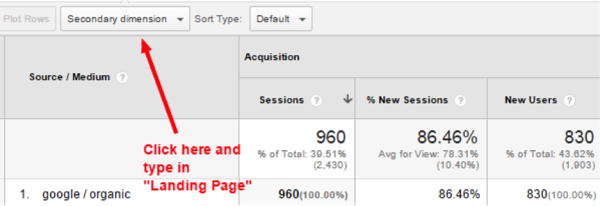
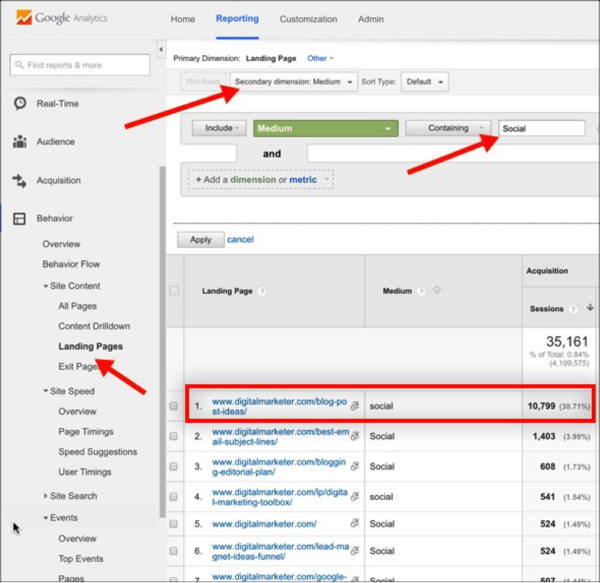
We add a “Secondary dimension” to drill-down and, in this case, to see which landing pages that Google is sending traffic to.
Once you’ve added that Secondary dimension, your report will look something like this:
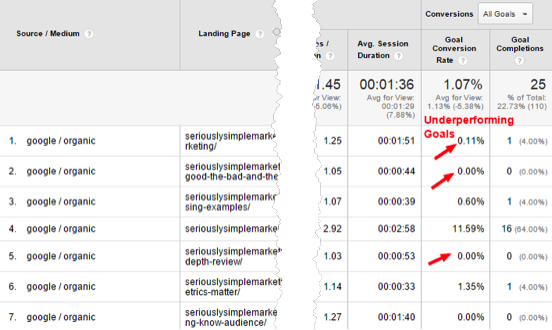
Pretty quickly we see visitors that visits to our homepage convert quite well, but there are a few pages that are getting traffic and not converting. It’s these pages where we’ll take a look to see how we can better optimize them to improve our results.
For example…
If they are blog pages, we’ll figure out how to add better “calls-to-action” in the content. This could mean adjusting the offer that displays in the pop-up to better match the topic of the blog post.
Or…
If they are sales pages, we’ll take a look at the entire page to find out where we can improve either the offer itself or how the offer is being presented. Sometimes it’s the simplest changes that make the biggest difference.
We once used this report on one of our clients’ sites, and found they were getting a ton of traffic to a sales page that they had forgotten about. It was an old promotion and they weren’t sending paid traffic to it themselves (but that didn’t stop it from ranking in Google!). We noticed the page was getting traffic and that the traffic wasn’t converting… at all.
We took a look and realized all the buy buttons had been disconnected (since the offer was over). Of course the conversions were zero… there was no possible way to buy!
Once the client was informed of all the potential traffic going to waste, they setup a redirect to the newer version of this offer and revenue began to climb.
Here are some similar reports…
- The BEHAVIOR > BEHAVIOR FLOW report will show you the actions people take after visiting your landing page. (Learn more about the Behavior Flow reports here)
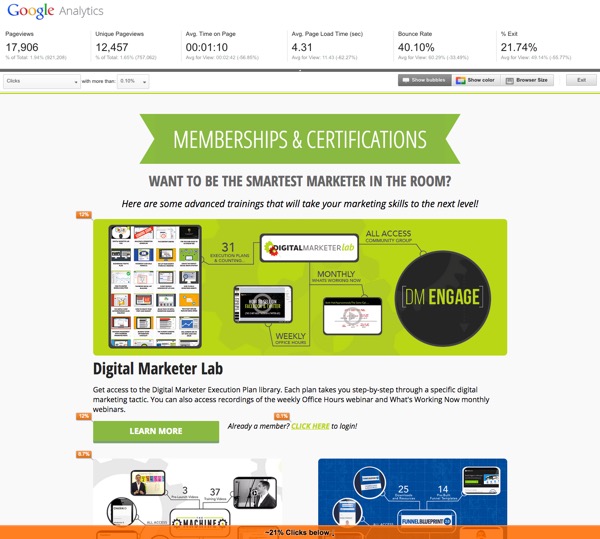
- The BEHAVIOR > SITE CONTENT > IN PAGE ANALYTICS report will show you where people are clicking on your web pages. Look at important landing and squeeze pages and remove anything (within reason) that is leaking clicks from your conversion pages.
X Marks The Spot
What’s the moral to this story?
While Google Analytics can sometimes be overwhelming and even downright frustrating, when you’re on the hunt for buried profit, asking the right questions makes all the difference!
Sometimes it’ll take a few clicks, but the details you discover can unlock all sorts of hidden profit potential.
Have a question?
Ask the DM team and 9,036 other members in the DM Engage Facebook Group!
Not a DM Lab Member? Learn more here.