


You’ve probably heard that you should track your marketing results.
After all, how else would you know what’s working and what’s not? But… “tracking metrics” isn’t always as easy as it sounds.
Especially when it comes to using Google Analytics!
Allow me to make it a little easier for you.
Before we get started, I’m going to make an assumption. I’m going to assume you have Google Analytics installed on your site. If you don’t, that’s your first step — start here.
By default, Google Analytics does a great job tracking your visitors as they traverse from page to page, but unless you know what you’re looking at, it can all get very confusing and pretty overwhelming. Don’t worry if it’s happened to you, we’ve all been there.
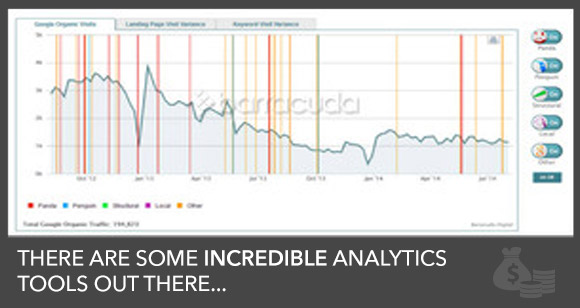
Thankfully, there are some incredible analytics tools out there that can simplify that, and I’m going to show you 5 of my favorites.
Most of these you’ve probably never heard of, but… a warning before you get started…
Just because the tools are listed here, doesn’t mean they are the perfect fit for every situation. Try them out, keep them around if they are useful to you and toss the ones that aren’t.
Let’s start with my favorite “hidden gem”:
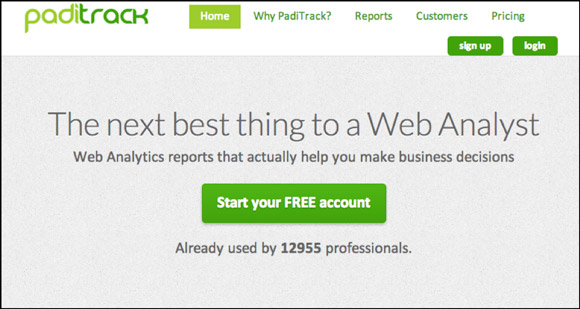
PadiTrack
Tracking funnels just got easier.
What does it do?
Like the other tools here, PadiTrack connects directly to your Google Analytics account, but displays that data in a much easier to understand format. In particular, when it comes to tracking a sales funnel.
Here’s an example of what that report looks like:
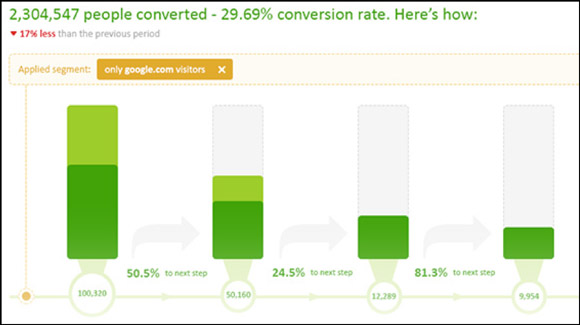
How cool is that?
Why is PadiTrack useful?
Among other things, PadiTrack shows you the conversion rate for each step of your funnel. This means you can quickly hunt down problematic areas in your conversion process such as a confusing call-to-action or an optin that may not be working.
You can also view how well your conversion funnels are doing against specific segments. As an example, you could create a segment of users that are from a new email campaign, traffic driven by a specific keyword, or from new visitors to your site who found you through Google.
PadiTrack has a ton of other great reports, but this one comes with the free version and it’s a “must add” to your analytics arsenal.
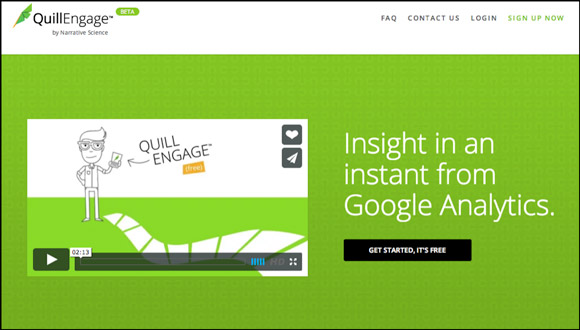
Quill Engage
Let the data tell your story.
What does it do?
Quill Engage is a fairly new, free service that takes data gathered from your Google Analytics account and translates it into an easy-to-understand report. So all those numbers and graphs? Practically gone! With Quill Engage you’ll get a weekly (or monthly if you want) email written in plain English.
Here’s an example of what that looks like…
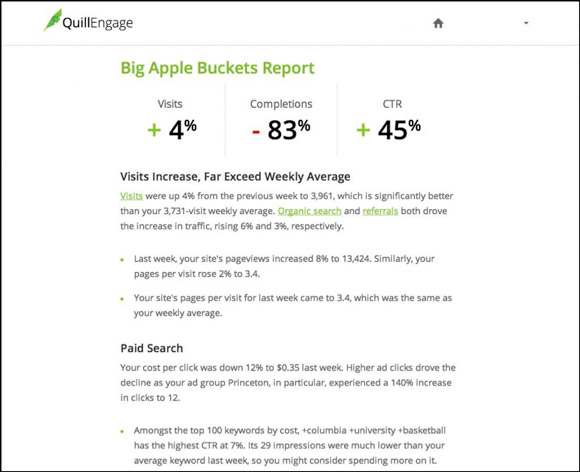
Why is Quill Engage useful?
Let’s face it…Google Analytics can be tough to get through.
Especially if you’re not sure how everything relates to one another. Quill Engage literally gives you the same data in straight English — and tells you a story about your data — so you can easily understand and act on it.
According to the developers, they will also be adding a new delivery format that allows users to publish it on Google Docs and reports will soon include new data sources such as goals and conversions.
Panguin
Has the latest Google algorithm update affected you?
What does it do?
One of the biggest obstacles online marketers can face is Google itself.
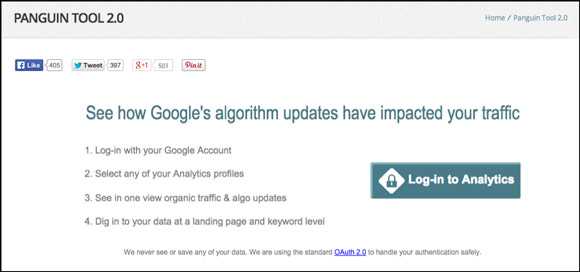
Specifically how Google search updates can affect traffic patterns. Panguin is a nifty tool that plots your analytics data and then plots each major (and most of the minor) update that Google releases. At a glance you can tell if your traffic was impacted by a recent update to the infamous search algorithm.
Take a look…
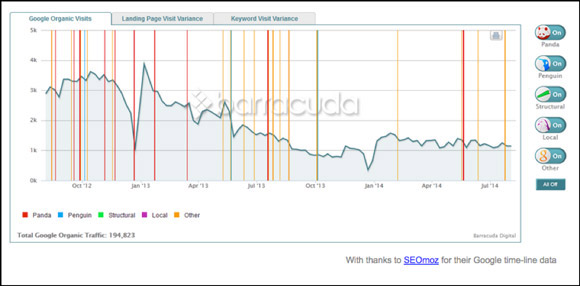
Each one of those vertical lines is a known Google update.
Why is Panguin useful?
It’s pretty straightforward.
As soon as you give Panguin access to your Google Analytics account, you can see how (or if) the new algorithm affected your site traffic. Plus you can toggle the various updates (Penguin, Panda, etc) on or off to customize your view.
Using Panguin, you can quickly figure out whether or not the changes in your traffic are based on penalties that Google handed you, or (GASP!) if you actually benefitted from the latest update.
N2K
What do you need to know?
What does it do?
This new kid on the block is finding its way and worth checking out.
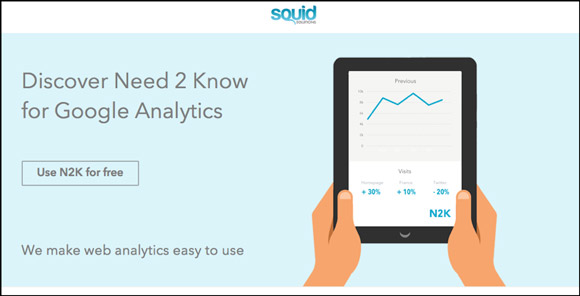
N2K gives users a one-page overview of their Google Analytics data while highlighting your key-drivers over the last month. In this way, it’s similar to the Quill Engage. The format is the biggest difference with this tool.
Here’s what I mean…
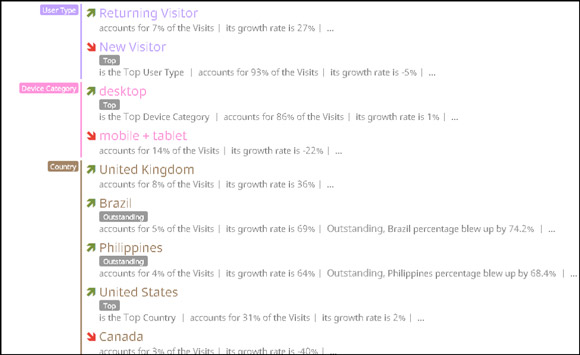
As you can see, they display the data in a column format, so you can quickly scroll through and detect month over month (or year over year) trends in your traffic sources, devices, etc.
Why is N2K useful?
All the complicated data gathered by Google Analytics is presented to you in compressed but comprehensive focus areas. You can do a quick health check on a variety of topics:
- Country,
- Traffic source,
- Landing pages,
- Visitors,
- Device types, and more.
It’s incredibly simple to use and you get a detailed report that automatically shows you what’s trending higher and what’s heading south.
G Analytics for Android or GAget for Mac OS X
Track your analytics on the go!
Can’t get enough data? Want to check your traffic sources from the road? Yeah… there’s an app for that!
What do they do?
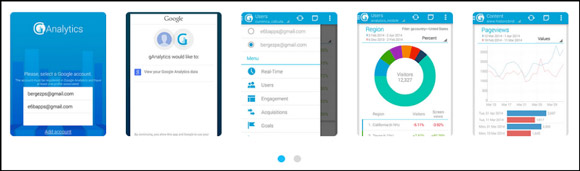
These apps are designed so that you can easily manage your data regardless of whether you’re on your desktop or on your mobile device. Both offer a complete rundown of your site statistics so you can easily monitor your stats.
Why are they useful?
I’m firmly in the Android camp, so I use G Analytics for Android. It’s intuitive, easy to setup, and works really well in terms of summarizing your data. You can download it via Google Play.
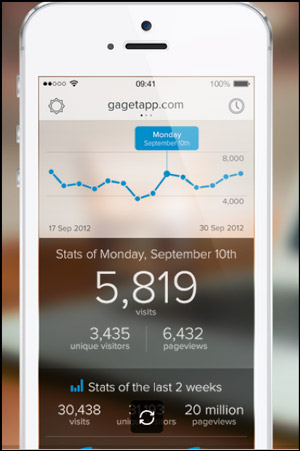
For Apple users, you can use GAget for Mac — available for Mac desktops and the iPhone.
Details are featured in a streamlined format, depending on how often you want to monitor changes to your site. The app automatically checks for updates making the often cumbersome task of reading through charts and statistics easier, faster, and simpler via your iPhone or your Mac’s dashboard.
Which will be your favorite?
The best thing about these tools is that they all currently offer a free (but still useful) version. They intuitively connect with, and enhance, your ever-reliable Google Analytics account.
As I said earlier, you don’t have to use all 5 of these analytics tools.
Your best approach will be to give each a try and see if they are a fit. Sit back and prepare to make the process of analyzing data for your site simpler.