


(Editor’s note: This post originally appeared on the TruConversion Blog. Read the original post here.)
I’ve spent my entire career…
- Evaluating split tests
- Sharing split test results
- Giving optimization advice
- And living in the optimization “trenches”
And I’ve come to find there is something MORE VALUABLE than split tests and it ACTUALLY moves the needle.
Don’t get me wrong, split tests are still important. But, they are a validation tool, not the source of new optimization insights that will truly make a difference.
So, what does make a difference? One word: heatmaps.
Let me show you how…
How Heatmaps Measure Data that Makes the Difference
When I first started running an annual state of optimization report, I found that customer research is the key to boosting your leads and sales.
Specifically, I found that heatmaps are an INCREDIBLE way to figure out how your customer interacts with your page, and this type of data is the stuff that really makes a difference.
 To illustrate this, let’s take a quiz. It’ll be easy, I swear! 🙂
Take a look at the landing page below and tell me if you know which call-to-action (CTA) button got the most clicks!
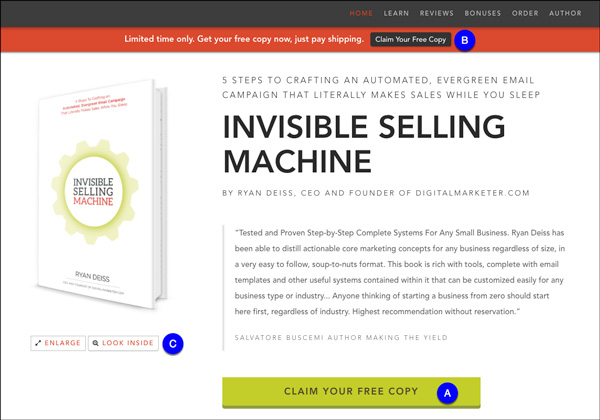
A) The Big Green CTA
B) The Black “Claim Your Free Copy” CTA (Note: This was a persistent CTA)
C) The “Look Inside” Ghost Button
So, which one do you think got the most clicks?
The answer may seem obvious but the runner-up gives the real insights! Okay, time to pick which you think won… no cheating.
…
….
…..
……
…..
….
…
If you guessed that A) Big Green CTA had the most clicks… well, you were right!
Here’s a heatmap of the page showing us click density:
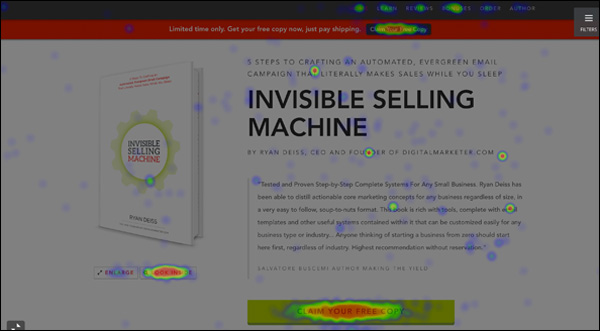
If you’ve never looked at a heatmap before, let me tell you what the heck is going on here: The higher the click density on a particular element, the “hotter” the area of a heatmap.
If you were looking at your own landing page, you’d want your CTAs to be red hot just like this big green button.
Okay, now that we’ve covered the basics, let’s dig into the results.
The Surprising Data the Heatmap Revealed
Like I said, the “Claim Your Free Copy” CTA button got the most clicks:

That’s a lot of clicks! Good thing it’s the main CTA!
Since the button…
- stands out
- has a compelling CTA
- is one of the main focal points of the page
…this isn’t really surprising.
However, we were surprised by the click rate on some of the secondary CTAs.
First, let’s dig into the smaller black button on the persistent bar, the Claim Your Free Copy CTA.
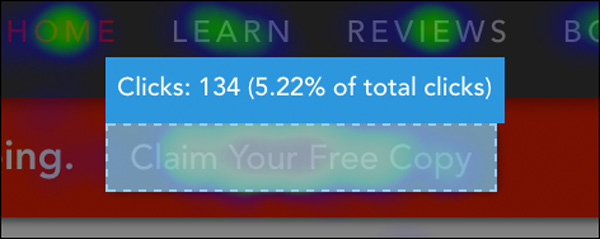
This got fewer clicks than any button on the page… for desktop visitors. At only 5.22% of clicks, this performed well but wasn’t the main interaction point for people who wanted to get a free copy of Invisible Selling Machine.
What was really interesting was that “Look Inside” ghost button. It was so interesting it’s going to get its own section…
I See Ghost Buttons
Okay I’ll say it:
I. Hate. Ghost. Buttons!
Ghost buttons are a designer’s attempt to make the page look nice without any regard to conversions.
However, if the button…
- is meant to be a secondary CTA
- supports the main CTA
- and enhances the understanding of the product
…then ghost buttons are fine by me!
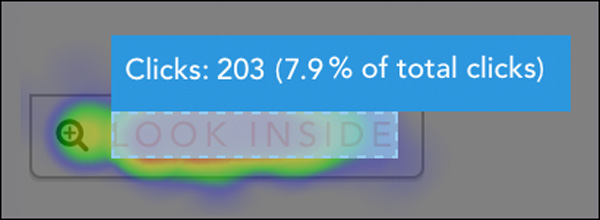
The “Look Inside” button got the second most clicks on this page at 7.9% of all page clicks. This ghost button was definitely seen by more than just Haley Joel Osment.
This has some pretty serious repercussions for people selling…
- Books
- Information products
- Actual products on ecommerce shops
Simply put: People want to see what they’re getting, and they will take the time to evaluate whether they want what you’re selling. 
That’s why the “Look Inside” button was so compelling and why this button worked.
Why does this matter?
Well, this is one of the most persuasive areas on the page.
If you offer “closer looks,” examples, or various images of your product, you’re going to get a lot of interest. You need to leverage this interest and make sure it isn’t competing with your main CTA.
In this case, the button seemed to support the offer and kept the main focus on that Big Green CTA button.
Finally, it’s worth noting that the click rate drastically changes when you look at mobile. The “Look Inside” button remained above the fold on a mobile phone but dropped to the least clicked element on the entire page.
People on mobile didn’t seem to have time to dig into the book; likely, they didn’t trust that clicking wouldn’t break the mobile experience. So, they scrolled through the page and ultimately clicked on one of the several big green buttons on the page.
So, we have some pretty interesting stuff, but now what?
How To Leverage the Heatmap’s Information
First, we know that the page elements are working as they should and there isn’t an issue of CTA competition. However, there is something DigitalMarketer can do to improve conversions.
When you click “Look Inside” you see this:
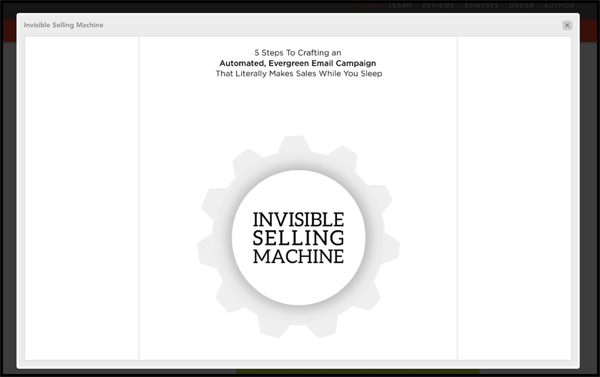
Users can scroll through and see the first few pages of Invisible Selling Machine as well as the back cover. Pretty cool right?!
But… there’s a missed opportunity!
To get back to the big green button, users need to close this modal window. 
See how we can turn insights into tests? If the light bulb hasn’t turned on for you yet, let me flip that switch. 🙂
DigitalMarketer should try testing out a CTA button in the modal window to improve clicks and conversions. There’s no better time to try to get them to convert then when they are ACTUALLY consuming part of the product they are considering.
Toss in a CTA and conversions will likely go up.
Heatmaps are a phenomenal way to come up with new ideas to improve the user experience EVEN IF your page is functioning as your user would expect.
Using this kind of report showed that there are a lot of visitors interested in further examination of the product, and DigitalMarketer should capitalize on this opportunity by asking users to buy while they are taking the closer look.