


Have you ran your first split test yet?
Last month I outlined how to create your first test and I’ve been excited to hear your results.
The test in the post started as a completely hypothetical example, but after seeing a flurry of tweets looking forward to the results I had to run it!
Full disclosure: I try to avoid tests that just focus on clicks and other vanity metrics. However, I wanted to show you just how easy it is to launch a test and gather the results.
Even though the KPI in this test was clicks on a top funnel page, I gathered some major learnings from other tools provided by the testing technology. Before I get ahead of myself, let’s take a look at the results and then I’ll share the most useful insight.
(If you’re just starting out and want split testing ideas, check out 32 of them here.)
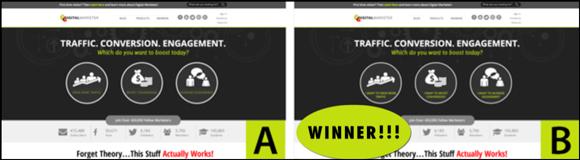
The Two Variations:

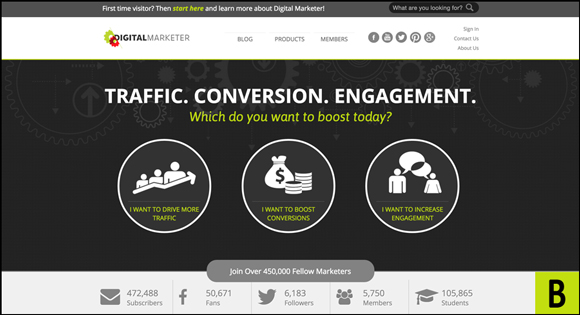
There was only one change made on this page, the copy in the three circular modules. Our control variation stated what the visitor learns when they click that module. In other words the goal is to have visitors self-segment based on their marketing needs.
Over the years I have seen amazing lifts by adding copy that gets the user invested in the content. Using words like ‘I’, ‘My’, or ‘Your’ will make a deeper connection with the visitor that wasn’t previously there. What sounds better to you when you are reading to yourself:
- Boost Conversions
- I Want To Boost Conversions
The visitor is being forced to read an ‘I Want’ statement, and the reflecting period after reading this headline probably goes something like:
‘Yeah! I do want to increase conversions, let me find out how.’
This was part of my initial hypothesis, but I had to test it out to see if it actually worked.
The Results
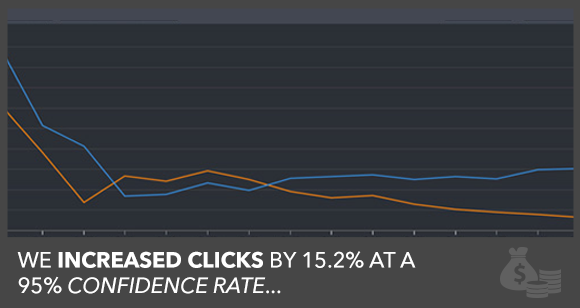
I was pleased to see the ‘I Want…’ challenger variation ended up winning. Adding the additional copy increased clicks by 15.2% at a 95% confidence rate. You can check out all of the data below:
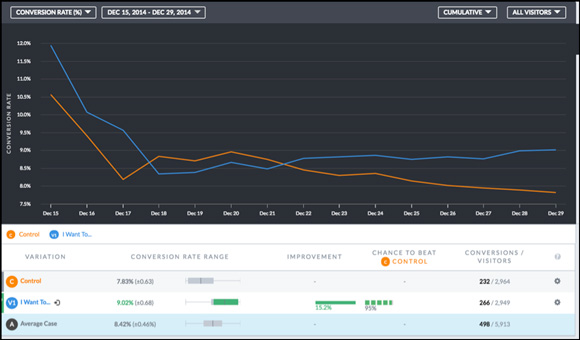
For those of you who test often, you all know the extreme volatility that comes with the first few days of testing. This is why it is absolutely crucial to identify your test duration and stick to it. This test took a few days for the data to normalize, which is totally normal.
As I said earlier, measuring top funnel engagement metrics doesn’t tell a huge story. In fact sometimes they lead to more questions than answers. However, with VWO, I was able to track total clicks on other areas of the page. What I found there was more useful than the learnings of the actual test!
The Click Data
Our homepage is fairly long and there are plenty of CTAs that compete with these above the fold modules. In fact, total clicks on all three modules only account for ~10% of all the clicks on the page!
I immediately asked, “Well, where are the other 90% of clicks happening?” I hoped that they were all going on our CTA buttons peppered throughout the page. However, I found out there are a lot of clicks happening on elements that aren’t clickable.
As you scroll down our homepage, we show a preview of DM Lab and a fraction of the Execution Plans that are available for Digital Marketer Lab members. This screenshot includes our effective ‘START EP’ button. Problem is, you can’t start the EP.
In fact… you can’t click anything.
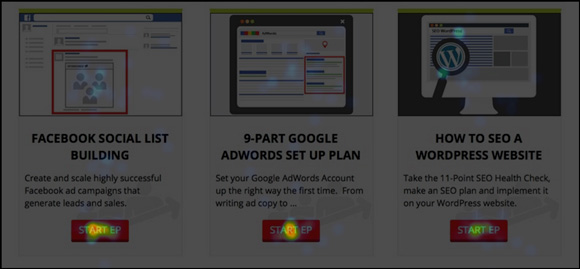
Total clicks on this image account for 12% of all clicks on the page! This loss in clicks just reeks of opportunity and speaks to the iterative nature of testing. Every test you run should inspire you to create new campaigns.
If 12% of clicks happen on an element that isn’t clickable, think about the potential lift in Lab sales if we just send the visitor to a landing page about that EP!
Guess which test I’m running now?
Yep… clickable ‘START EP’ buttons. We’re going to send cold-clickers — visitors who aren’t DM Lab members and haven’t visited the site within the last 30 days — to a landing page with more information about Lab and what exactly these Execution Plans will give them.
We have done some things right though! Most of our visitors are trained to use the header to navigate the site:
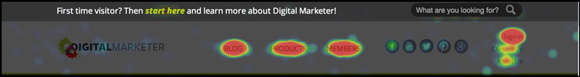
The ‘Sign In’ link alone accounts for 22% of all clicks. Also notice the increased activity over ‘Blog’, ‘Products’ and “Members’. The header alone accounts for 72% of all clicks on the page. Good thing these clicks actually lead to a corresponding page this time :).
Final Thoughts
The real goal of this test was to inspire you to get your own tests started immediately. When I clicked the ‘Start’ button, I had every intention of sharing each data point regardless of the outcome.
Going forward, I’ll only run tests that I can connect to our main KPIs. Don’t worry; as I build out those tests I’ll create an awesome step-by-step guide so you can track deeper funnel metrics without a hitch.
Have a question?
Ask the DM team and 9,036 other members in the DM Engage Facebook Group!
Not a DM Lab Member? Learn more here.