


Are you ready for this?
I’m back again with another split test result on the Digital Marketer homepage.
During my last split test, I noticed a HUGE opportunity.
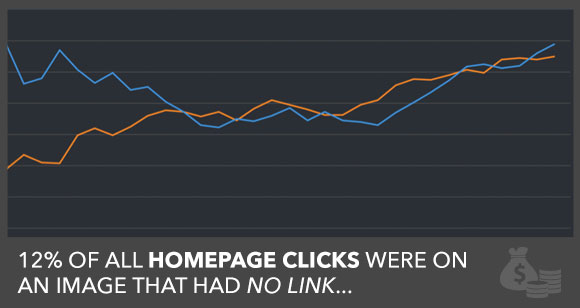
The insight came from the heat map function in Visual Website Optimizer. When looking at the home page heat map I saw that we were getting A LOT of clicks on an image that wasn’t a link.
No bueno.
Here’s a piece of that heat map…
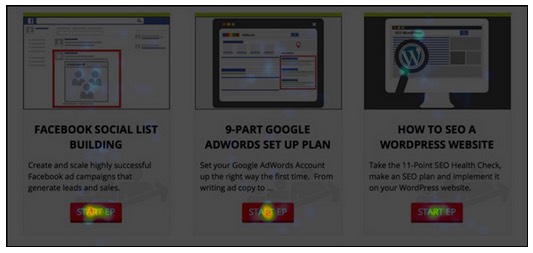
Those are images of the Execution Plans (mini courses) that are part of our Digital Marketer Lab product.
These clicks represented people that wanted to, at the very least, learn more about these mini courses in Digital Marketer Lab. Unfortunately, clicking on this image didn’t take them anywhere. The image wasn’t linked to anything.
Time for another test.
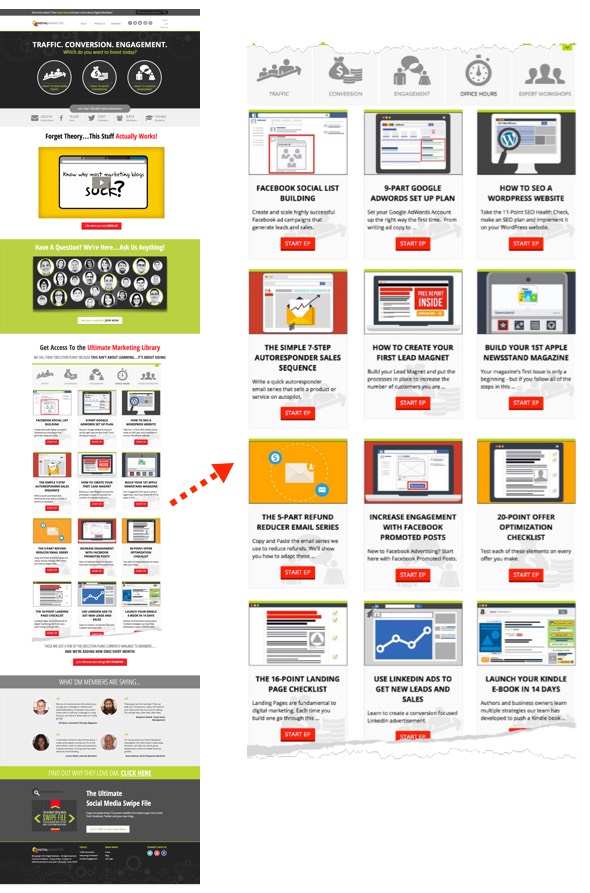
On the left you see the Digital Marketer home page and on the right is a blown up version of the image that was tested…
We knew from the last test that 12% of all homepage clicks were on an image that had no link.
This was a major area of opportunity, so we wanted to test whether adding a link would actually help our bottom line.
The Test
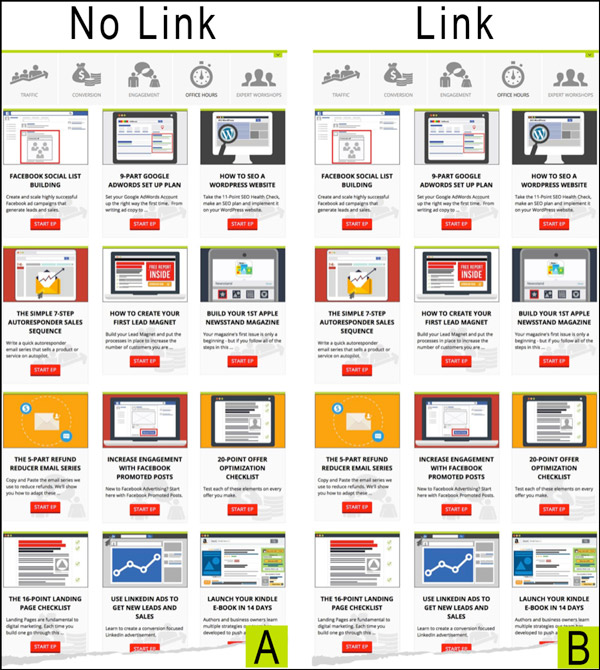
The test was straightforward, we had one variation with no link and the test variation that linked to the DM Lab sales letter landing page.
We hypothesized that adding a link to this image for all visitors would increase the sales page views and in turn increase DM lab sales. We measured 3 total metrics:
- Clicks
- DM Lab Add-To-Cart
- DM Lab Sales
Because of the heat map results in the first test, we knew that clicks to the Digital Marketer lab sales page would increase.
However, we weren’t sure what would happen after a visitor hit this landing page. This is why we ran the test rather than simply making the change.
We wanted to gather more user insights and see if the sales letter page would convert people who were showing interest in particular Execution Plans.
The Results
After testing over 21k visitors over 5 weeks version B, the variation that linked to the sales letter, was the big winner. The linked image increased clicks to the landing page and DM lab sales. However, there was no statistical difference between the add-to-cart rate.
Here is the detailed information:
Clicks To Landing Page
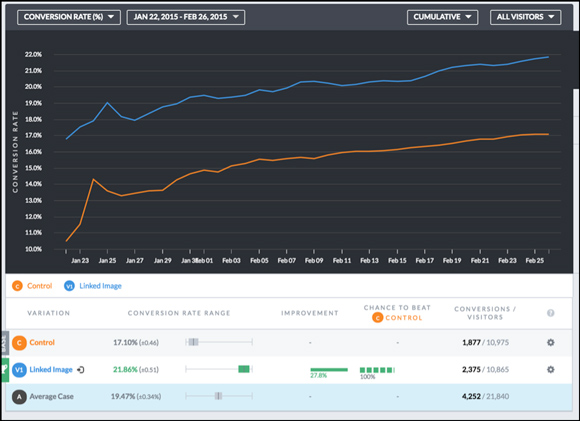
By adding the link to this image, we saw a 27.8% increase in clicks to the landing page at a 99.9% confidence rate*. This was not surprising at all – if you add a link to an image that gets clicks, that linked page is going to get more views.
(NOTE: VWO rounds up the 99.9% confidence rate to 100%. I report this as a 99.% confidence rate because a 100% confidence rate is statistically impossible.)
Add-To-Cart
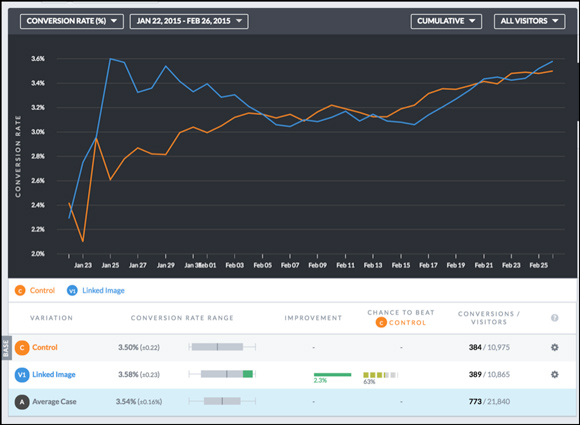
The numbers reported a 2.8% lift at 68% confidence. That said, you can see in the graph that there is plenty of volatility and that there is no real winner between either variation. This is the most interesting result of the test, and I’ll explain why in the next section.
DM Lab Sales

This was the metric that really mattered.
We saw a lift a 40.7% lift in DM Lab sales at a 99% confidence rate. Notice, I didn’t wait for the losing variation to get to the ‘100 conversion’ threshold. This test ran for a total of 5 weeks and the data had normalized so I was confident in calling the test.
Even though this is the most important metric, I don’t find it to be the most interesting. If you can increase the landing page views, but the add-to-cart rate is relatively the same, it only follows that the purchase rate would increase. Even though this metric justifies the test, it doesn’t tell us a whole lot.
Why The ‘Non-win’ Is So Important
I firmly believe the most interesting part of this test is the add-to-cart rate.
The non-lift shows that the visitors who landed on the page were simply not ready for the sales letter. The content did not meet their expectations. Think about it, you just click ‘Start EP’… on the Facebook Social List Building EP…
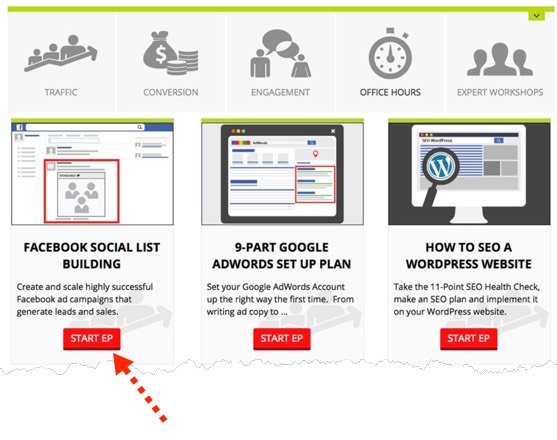
and then you see this:
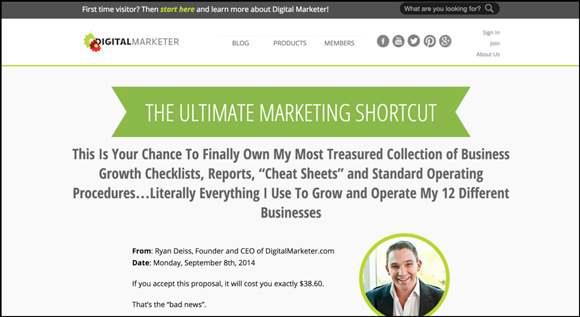
There is clearly a disconnect between the click and the content.
Skilled pay per click advertisers know it’s best practice to maintain continuity between the ad click and the landing page, this is no different for clicks on your website.
The image of the Execution Plans on the home page is an offer.
It is the promise and the landing page is the fulfillment. We clearly weren’t fulfilling the promise on our end.
Let’s dig into the numbers a little more. All of the percentages above are based off of the entire population, but what if we analyzed the add-to-cart rate in comparison to the landing page views? That unleashes a totally different story.
Version A saw 1,877 people visit the landing page after clicking this button:

Of these 1,877 people 384 people added DM Lab to their cart. That’s a 20% conversion rate.
In comparison, Version B only saw a 16% add-to-cart conversion rate (based on landing page view and not total tested traffic). A post-hoc analysis shows that when these numbers are put in context we actually had a losing variation!
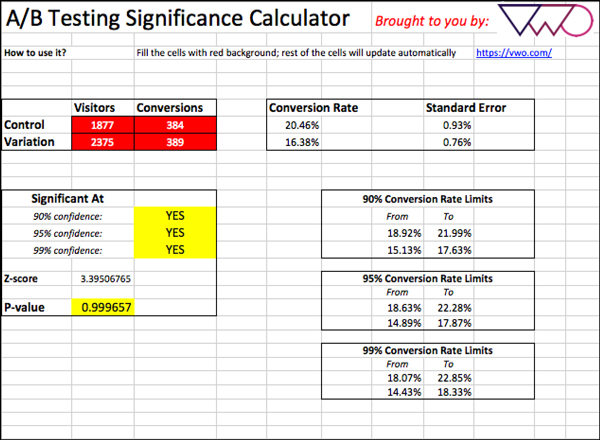
I plugged the numbers into VWO’s statistical significance calculator to get a better understanding of the numbers. When the add-to-cart conversions were compared to the whole population there was no statistical difference. However, when you put the numbers in context and compare them to the visitors who actually saw the landing page, you’ll notice one variation had 26% more visitors but only 5 more conversions.
What was initially a ‘no-win’ variation was actually a loss. This loss becomes a major opportunity for our next test: strengthening the message match between expectation and landing page.
Clearly, this message mismatch is a problem that needs to be addressed. The linked variation was bleeding potential add-to-carts, all because the generic landing page doesn’t match the visitor’s expectations.
Final Thoughts
First things first: make sure to dig into your numbers as they reveal valuable insights. The initial ‘non-lift’ ended up telling a much different story and has become valuable information for future tests.
As with any test, your initial experiment will give you new insights and test inspiration. This test showed us just how important it is to fix this broken message. This leaves us with a couple of options.
1. Change the image altogether to promote DM lab without getting people excited about individual execution plans and mixing up the message.
2. Change the landing page to reflect the clicked content. This could be done two ways:
- Promote the individual EP sale
- Showcase the EP and pivot to a DM lab sale